All my reports are currently failing during refresh, and I am receiving several OData-related error messages. Below are two examples with the full error details:
Error 1
Data source error: DataSource.Error: OData: Invalid JSON. Unexpected end of input was found in JSON content. Not all object and array scopes were closed. Microsoft.Data.Mashup.ValueError.DataSourceKind = OData. DataSourcePath = https://bridge-online.cloud/XXXX/odata4/VismaNet.PurchaseReceipt.BasicPurchaseReceiptLines@vnt. The exception was raised by the IDataReader interface. Please review the error message and provider documentation for further information and corrective action.

Cluster URI: WABI-NORWAY-EAST-PRIMARY-redirect.analysis.windows.net
Activity ID: 27927219-1b2b-4f49-a71c-4ebfc4b723ee
Request ID: 8e0d0179-720e-4e6c-a30b-c7790cb8143f
Timestamp: 2026-10-11 14:00:01Z
Error 2
Data source error: DataSource.Error: OData: Request failed: The operation has timed out. Microsoft.Data.Mashup.ErrorCode = 10122. Microsoft.Data.Mashup.ValueError.DataSourceKind = OData. DataSourcePath = https://bridge-online.cloud/XXXX/odata4/VismaNet.SalesOrderV2.SalesOrderShipmentsV2@vnt. The exception was raised by the IDbCommand interface.

Cluster URI: WABI-NORWAY-EAST-PRIMARY-redirect.analysis.windows.net
Activity ID: 87d89f9e-10c8-4add-8276-cb2fce61f08e
Request ID: 7e1649a7-cbc6-494d-bda6-ad50c4694337
Timestamp: 2026-10-07 05:15:12Z
Do you have any advice on what may be causing these errors and how they can be resolved?
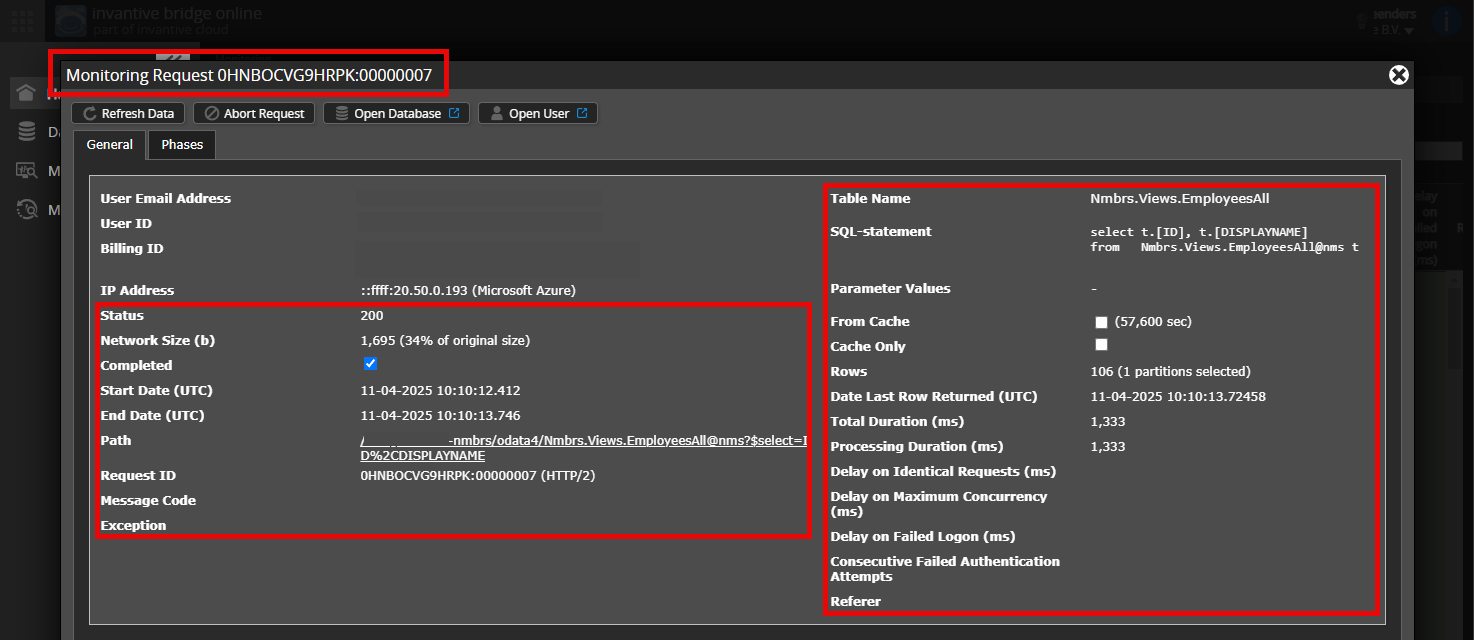
Is it possible to add an (anonymised) screenshot of the request details in Online Monitoring on Invantive Cloud as described in Meer inzicht met nieuwe Online Monitoring?
You can find the details by clicking on the download request that represents the subject of this topic.
The download request usually contains an SQL statement in which the table name is visible.
Please ensure that at least the following data is visible from both columns:
the title bar with the request ID,
the status code, network size, path, and timestamps in the left column,
the error code and error message at the very bottom of the left column,
the entire right column including the SQL statement, table name, and parameter values.
Carefully check that you log in to the Invantive Cloud website using the same username with which you process data, for example, via Invantive Bridge Online. You will only see the requests of the Invantive Cloud user with whom you log into the website.
Check Correct Request and Details
Ensure that you select the request first to display the details. Only one request should be visible in the screenshot.
Also, carefully check whether the request has a path with odata4, apps or mcp. Requests with other paths are generally not relevant for this purpose.
Error Message and Tips via Email
Additionally, the Invantive Cloud user who has the error message will often receive an email with an error message and tips on their email address if there is an error message in Power BI, Power Query, Azure Data Factory, Qlik, or Tableau.
It is recommended to check the spam of the involved user for such emails sent from support@invantive.eu.