Supplementary Information
Is it possible to add an (anonymised) screenshot of the request details in Invantive Bridge Online Monitoring as described in Meer inzicht met nieuwe Online Monitoring?
You can find the details by clicking on the download request which represents the subject of this topic.
The download request usually contains a SQL statement where the table name is visible.
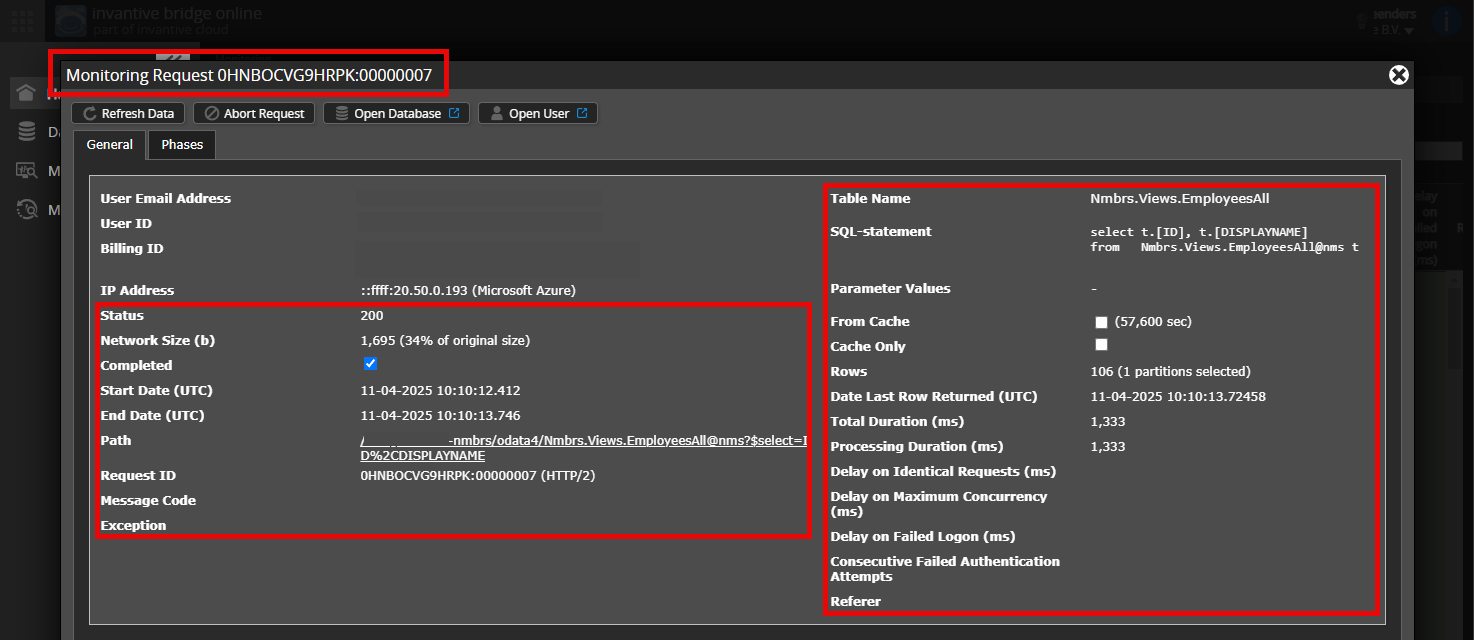
Please ensure that at least the following information remains visible from both columns:
- the title bar with the request ID,
- the status code, network size, path and timestamps in the left column,
- the error code and error message at the very bottom of the left column,
- the entire right column including the SQL statement, table name and parameter values.
For example:
Check Correct Server and User
Carefully check that you log in to the Bridge Online website, which is also used from Power BI and with the same username. You can only see the requests of the Invantive Cloud user with which you log in to the website.
There are four servers in use:
bridge-online.cloudapp-online.cloudbridge-online.invantive.comapp-online.invantive.com
You can see the server used in your script or reporting source code.
Check Correct Request and Details
Make sure you select the request first to display the details. Only one request should be visible in the screenshot.
Also, carefully check whether the request has a path with odata4 or apps. Requests with other paths are generally not relevant for this purpose.
Error Message and Tips via Email
In addition, the Invantive Cloud user who received the error message will often receive an email with an error message and tips if there is an error message in Power BI, Power Query, Azure Data Factory, Qlik or Tableau.
It is advisable to check the spam of the involved user for such emails sent from support@invantive.com.