Detailed SQL execution analysis using “SQL execution steps” has become available starting in release 24.0.
SQL execution steps is fine-grained logging of the execution of a SQL-statement, including the execution plan, I/O activity and sleep activity, in the Invantive UniversalSQL environment where also an individual SQL statement executes in parallel, returning streaming data.
This article is inteded for professionals and enthusiasts who have a solid foundation in SQL and are looking to delve deeper into how SQL queries are executed, optimized, and analyzed within a sophisticated Universal’s SQL-engine environment, such as database administrators, developers and data analysts. Prior knowledge on SQL execution plans and the importance of analyzing query performance is recommended.
Simple Sample
When executing the following statement with two Exact Online-company selected:
select *
from   exactonlinerest..journals@eol
the SQL execution steps can be retrieved in real-time from the data dictionary. First step is to find the SQL statement ID using:
select ID
,      SQL_STATEMENT
from   SystemSqlArea@datadictionary
order
by     LAST_END_TIME desc
In this case, the statement ID is 59580a0d-2c72-4737-848e-7ce480bc310f. A statement can have been executed multiple times; each one with a different execution ID.
All executions of a SQL statement can be found using a query such as:
select id
,      row_count
,      IO_NUMBER_OF_PARTITIONS
,      DURATION_MS
from   SystemSqlExecutions@datadictionary
where  statement_id = '59580a0d-2c72-4737-848e-7ce480bc310f'
The individual steps in the SQL execution can be retrieved using:
select ID
,      PARENT_ID
,      DEPTH
,      DURATION_MS
,      DESCRIPTION
from   SystemSqlExecutionSteps@datadictionary
where  STATEMENT_ID = to_guid('dc6a993d-e516-4fe4-8831-b90f90c9bca7')
such as:
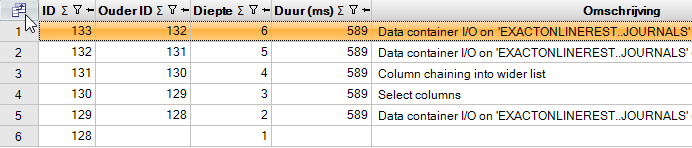
The structure of SQL execution steps is a “tree”. In this case, the last row is the root of the tree and has ID 128.
Visually such a statement can be depicted as:
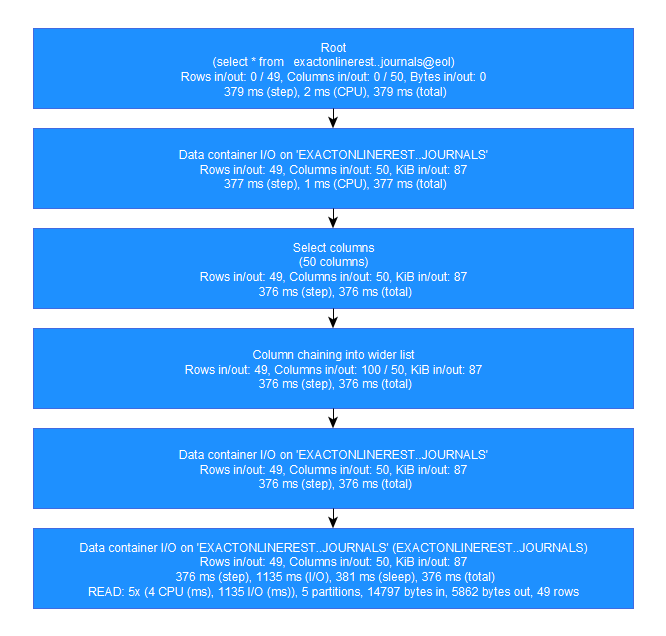
Note that the bottom box describes the actual I/O on the data container. In this case, 5 I/Os were executed across 5 partitions, retrieving 14797 bytes of data (in this case somewhat less efficient formatted as JSON) and return 5862 bytes of data in 49 rows.
More Complex Example
A more complex example is the execution of the SQL-statement:
select *
from   exactonlinerest..journals@eol jnl
join   TransactionLines@eol tle
on     tle.division = jnl.division
and    tle.journalcode = jnl.code
and    tle.financialyear = 2024
where  jnl.code = '60'
which retrieves all financial transaction lines booked in 2024 for the general ledger 60 (Purchase) in a very slow way (it is better to use TransactionLinesIncremental in general for reporting purposes or for volumes exceeding few thousand entry lines). The UniversalSQL optimizer creates an efficient execution plan, using knowledge about the data model. This execution plan retrieves the data from the (slow) API using extensive filters. This can be seen in the SQL execution steps using:
select ID
,      PARENT_ID
,      DEPTH
,      DURATION_MS
,      ROWS_IN
,      ROWS_OUT
,      DESCRIPTION
from   SystemSqlExecutionSteps@datadictionary
where  STATEMENT_ID = to_guid('58d554fb-ff8e-4250-94dc-52dee71f9d2f')
as:
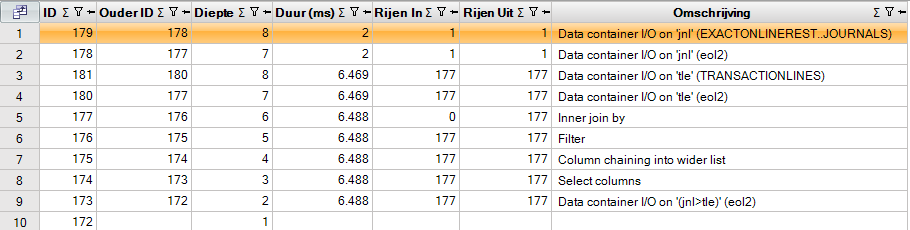
The “inner join by” with ID 177 is the parent of both 178 on Journals as well as 180 on TransactionLines.
Was the Query well Optimized?
There were only 4 API-calls needed to retrieve the data as can be established using:
select url
from   sessionios@datadictionary
where  SQL_EXECUTION_STEP_ID in (179, 181)
as:
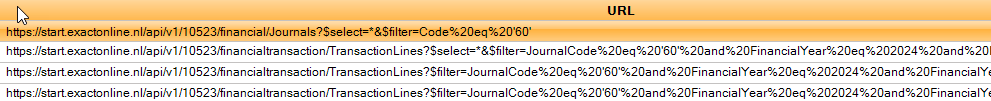
The UniversalOptimizer has optimized the calls, since it discovered there were just few (as in ‘1’) journal with code 60. This filter is added to the query on TransactionLines as a filter:
...$filter=JournalCode eq '60' and FinancialYear eq 2024...
Sleeps during Processing
Besides session I/O’s, there can also be moment during processing when UniversalSQL deems a delay necessary, for instance due to a rate limiter on an API. Delays introduced by sleeps can be found in the table SystemSqlExecutionSleeps, such as:
select *
from   SystemSqlExecutionSleeps@datadictionary
as:
As sample of a rate limiter on Exact Online is the minutely limit of 60 API calls per division for apps not provided by Exact itself. This limit can be triggered by calling a relatively fast API continuously as in:
select /*+ http_disk_cache(false) http_memory_cache(false) */ *
from   transactionlines@eol
limit  5000
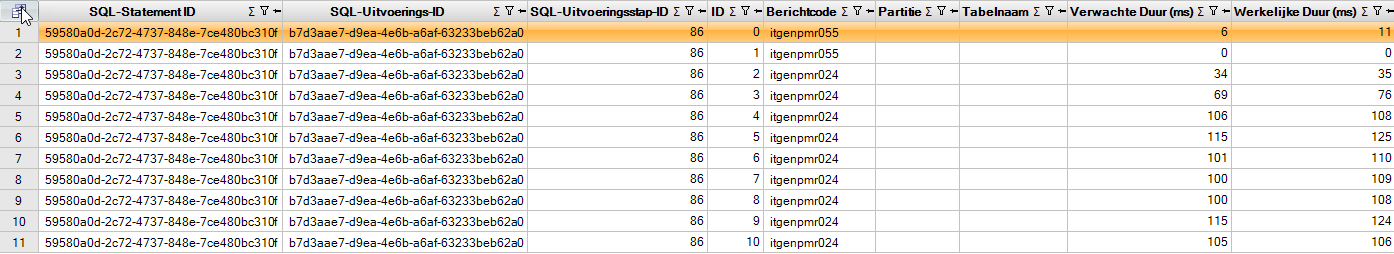
The execution steps are:

This executes over 80 API calls on Exact Online and takes 71 seconds to execute on a single company/partition. Each API call takes 200 ms, which causes the minutely limit to be reached within approximately 16 seconds. The UniversalSQL-driver then pauses for the rest of the minute after which 60 more API calls become available again.
The 211 ms sleep are introduced after the long rest since the first API call on Exact Online after the sleep took a little shorter (210 ms) compared to the average of 268 ms, and the long sleep was actually a little too short.
The most common message codes found are:
itgenpmr024: spinning between 0 and 100 ms (125 ms when parallel) on data consumer while waiting for lower nodes to produce data.itgenpmr055: random sleep between 0 and 10 ms on data consumer to allow parallel threads to distribute peaks in CPU-load more evenly in time.itgensrt018: slot-based rate limiter (see ).itgenncr002: delay native platform calls on maximum parallel capacity of HTTP-based drivers across ALL partitions as defined byrequests-parallel-max.itgenase442: delay to wait for a free connection in the connection pool for ANSI SQL-based drivers.itgenhbr135anditgentpr096: pre-HTTP request delay when HTTP-based drivers signals excessive speed such as through a HTTP header or 429 error. This can happen despite slot-based rate limiters since there can be multiple independent processes or servers sharing the same API rate limit.itgenhbr136: post-HTTP request delay when HTTP-based drivers signals excessive speed.itgensql637: delay to reduce speed ofINTERNETTABLEtable since there is no work currently across all spiders.
There are dozens of other message codes used to signal delays, but these will cover most scenarios.
Sleeps Across Multiple Companies in Parallel
When retrieving 25.000 entries across five Exact Online companies, the default behaviour for parallelism is controlled by the setting of requests-parallel-max on the driver instance. The default value is 8 in most scenarios. This setting is available on all platform drivers that support partitioning such as Twinfield or Visma.net (before Visma Connect was introduced).
This allows the five Exact Online companies to be retrieved in parallel.
The sleep behaviour during execution is then controlled per company, since the minutely rate limit is per company. The column PARTITION signals for which partition a sleep is introduced in the execution.
A visual representation when executed for a single Exact Online company would resemble:
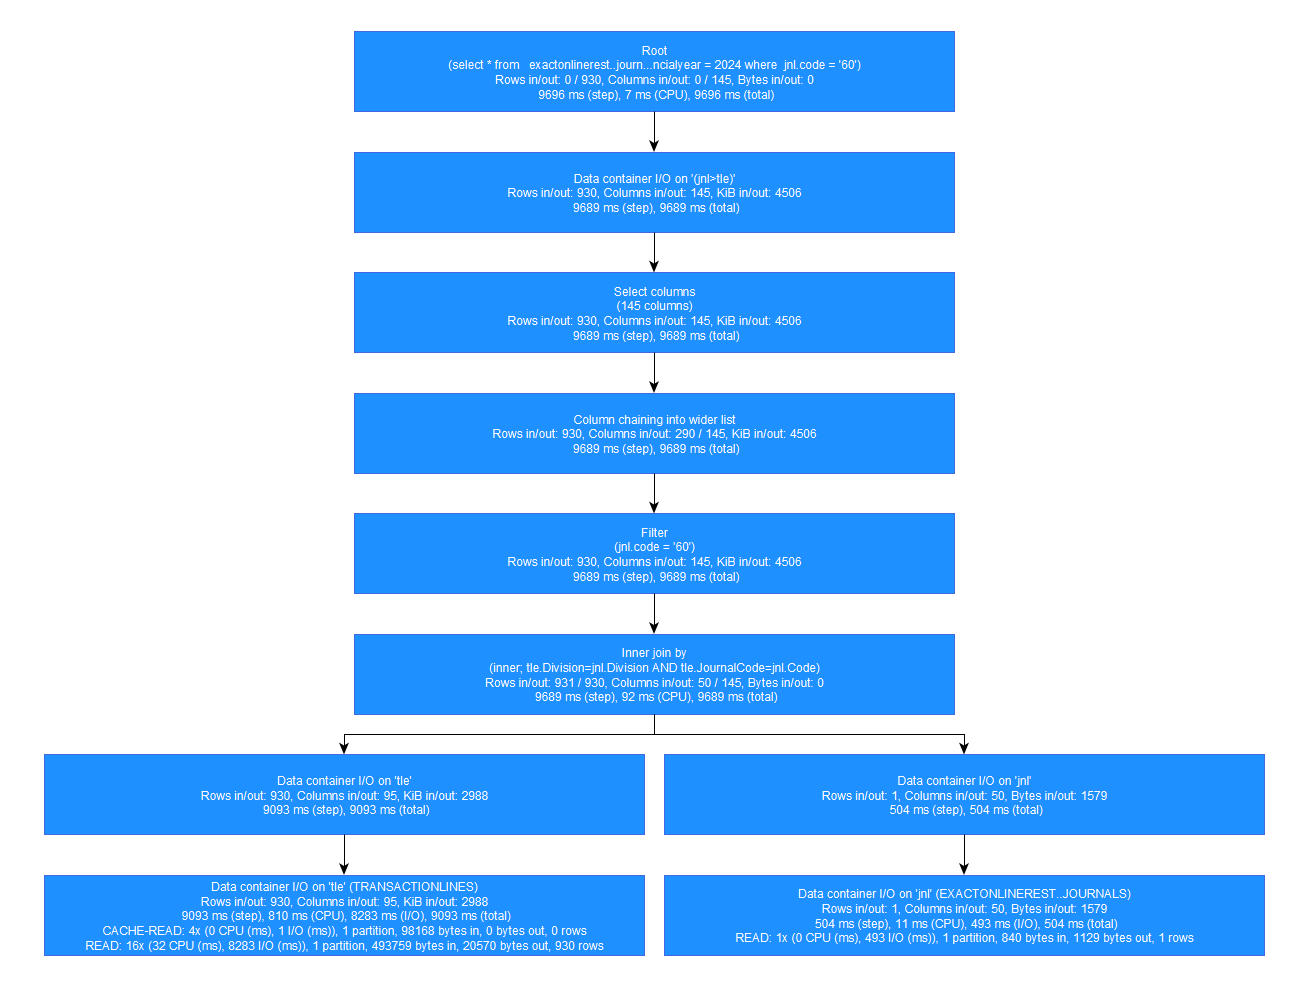
When executed for 5 Exact Online companies, the results are different for the data container I/O boxes:
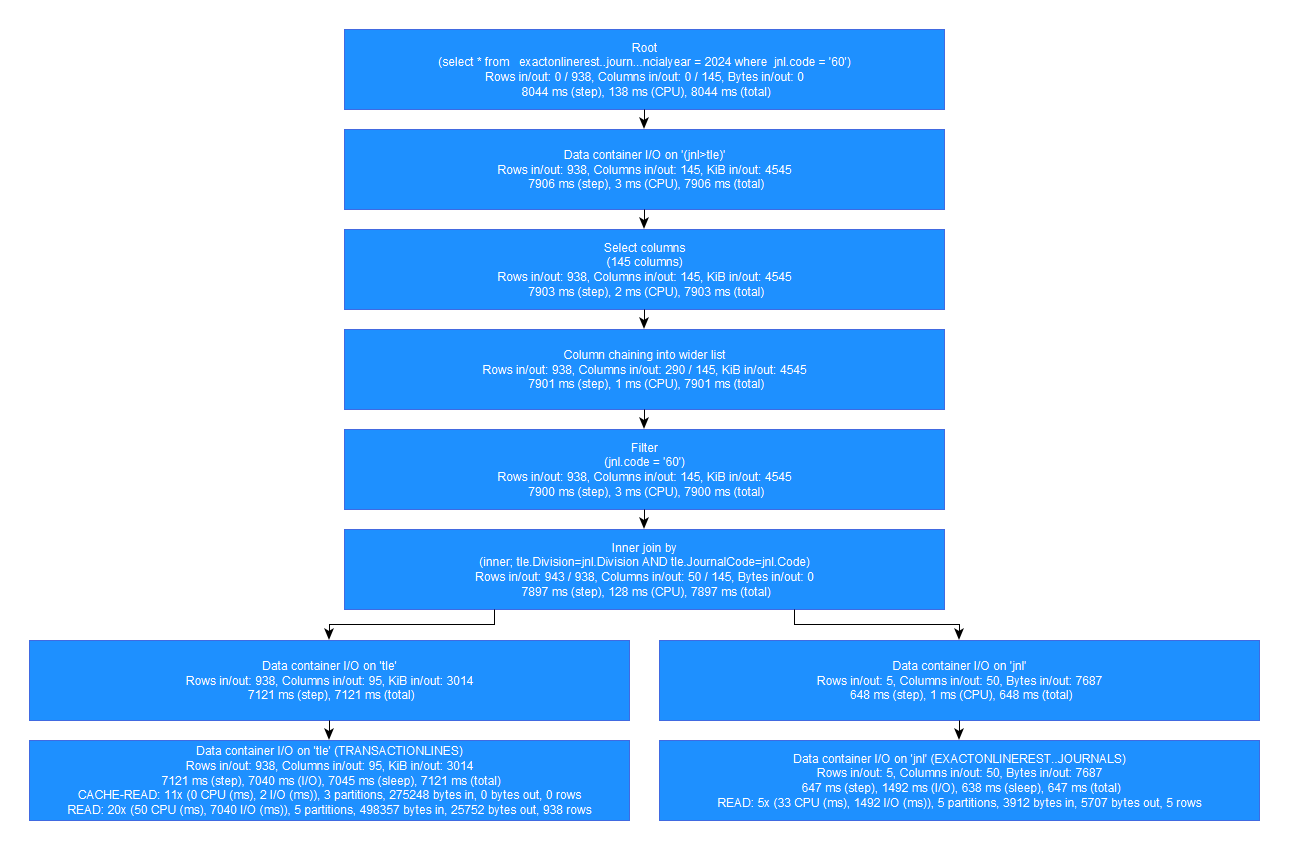
Despite querying more companies, the total execution time is similar due to parallelism.
Rate Limiters
Many APIs pose limits to the maximum number of API calls within a timeslot. These are called “rate limiters”. Typically, there are one or a few rate limiters at the same moment relevant, like 100 calls per minute per company, 5000 calls per hour across all companies and monthly at most 100.000 calls.
Depending on the duration of a cycle, Invantive UniversalSQL handles each rate limiter as a “soft limit” or a “hard limit”. A soft limit has a short cycle duration so waiting a few seconds or minutes will allow for more calls to be executed. A hard limit has a longer cycle duration like an hour or a day.
The waits on rate limiters are also available in the data dictionary.
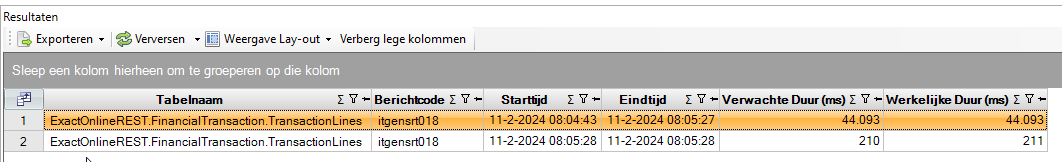
The following query is quite clumsy, triggering a lot of unnecessary API calls across five companies/partitions:
use all@eol

select *
from   ExactOnlineREST..transactionlines@eol
limit  36000
The visualization shows delays due to sleeps introduced for rate limiters:

The total sleep duration was 1.062.054 ms. With a total execution time of 594.426 ms, this means that approximately 2 parallel readers were waiting for a rate limiter slot to become available all the time.
However, when there are many companies/partitions, such as hundreds or thousands, the Invantive UniversalSQL-engine will try to spread the load across all companies. In general, this ensures that all parallel threads are almost never waiting for a rate limiter.
Log SQL Execution to Disk
The SQL engine has settings to log the execution steps per SQL-statement to disk for analysis purposes. The following two SQL-engine properties configure the logging to disk:
invantive-sql-execution-profile-to-disk: boolean setting whether to log SQL execution steps to disk.invantive-sql-execution-profile-disk-path: file name and path to append the SQL execution steps to.
The file will contain detailed SQL execution steps information in a NDJSON format. The file is updated at the end of the execution of a SQL statement.
The current values of SQL-engine properties can be retrieved through a query on driver attribute values, such as:
select code
,      value
from   SystemProviderAttributes@DataDictionary
where  code
       in
       ( 'invantive-sql-execution-profile-to-disk'
       , 'invantive-sql-execution-profile-disk-path'
       )
Through environment variables these properties can be configured:
INVANTIVE_PROFILE_TO_DISK: configure value ofinvantive-sql-execution-profile-to-disk.INVANTIVE_PROFILE_PATH: configure value ofinvantive-sql-execution-profile-disk-path.