The Invantive status page provides an overview of the status of most Invantive services. An abbreviated view can be seen in the top right corner of the forums in the form of a traffic light. The status page with all details opens by clicking on the traffic light or by navigating to https://status.invantive.com.
Effective December 1, 2021, the status page has been expanded to include eight graphs that provide an insight into the variations over time of:
- the different throughputs of Invantive Cloud,
- the speeds and reliability of the Exact Online APIs.
The time display is in UTC. UTC is currently 1 hour earlier than the Netherlands (December 1, 2021) and sometimes 2 hours earlier depending on daylight saving time/winter time.
The figures are updated every hour after the end of the full hour. The situation for the previous hour is then determined and shown. In some cases also the expected situation for the current measurement period time is already shown.
Exact Online is the only platform included separately because around 60% of the users work with it.
From December 1, 2021, the figures have been measured continuously. Based on historical figures, the four weeks prior have been provided with measurements as accurately as possible.
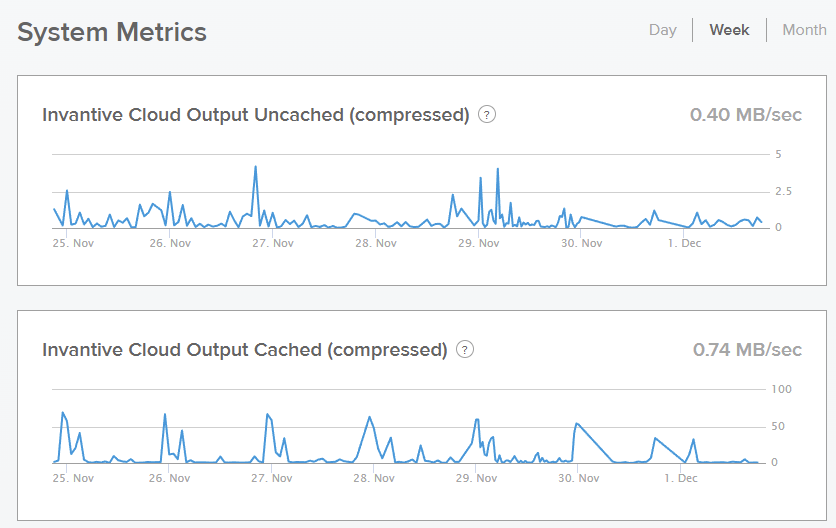
Throughput speeds of Invantive Cloud
The throughput rates on Invantive Cloud fall apart into four parts:
- the download speed of a single download compressed where the data is not from OData4 cache,
- the download speed of a single download compressed where the data does come from OData4 cache,
- the download speed of the various underlying (cloud) platforms,
- the download speed of specifically Exact Online.
The first two measurements are represented in throughput on the network after compression. The actual speed in for example Power BI is up to 80 times better: 8x acceleration due to parallel downloads and 10x acceleration due to decompression.
The download speed of the platforms is without compression. The actual speed can also be significantly higher here because, for example, separate partitions (administrations on Yuki, Exact Online and Twinfield) are accessed simultaneously and multiple downloads take place simultaneously on the same partition.
The absolute numbers don’t say convey the whole story; a speed of 400 KB/sec per stream compressed as in the image below says little when the actual total processing in Power BI is 32 MB/sec. However, variations along the time axis do indicate trends.
For example, large spikes around midnight indicate that relatively fast and massive downloads occur then:
These first four graphs only contain measurements on the throughput of Invantive Bridge Online and Invantive App Online, as part of Invantive Cloud.
Speed and reliability Exact Online APIs
The measurements about the Exact Online APIs fall into four components:
- the response time within which 95% of all requests for a simple REST API fall (60 rows),
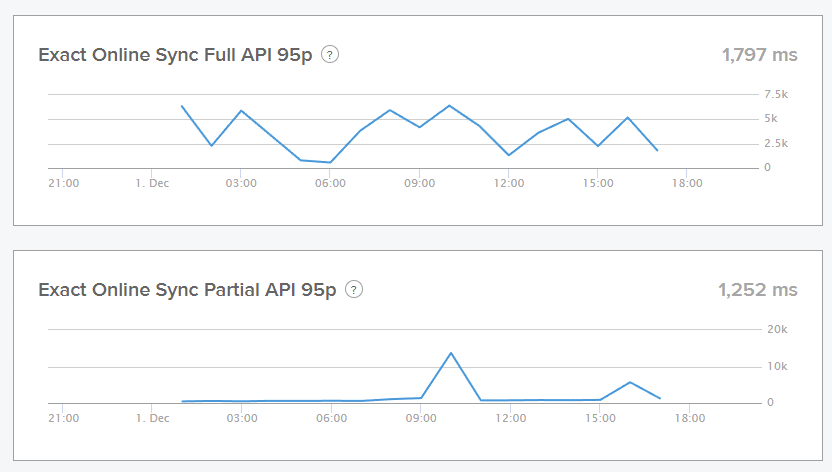
- the response time within which 95% of all requests for a full page (1,000 rows) from the so-called sync API fall,
- the response time within which 95% of all requests for mutations with up to 100 rows fall on a so-called sync API,
- the reliability of receiving a response to a request to the Exact Online API.
For other key figures on the status of Exact Online please visit the page Hoe vraag ik de status van een Exact Online storing op? (Dutch only).
All measurements about the Exact Online status are based on anonymized end-to-end measurements on network devices running Invantive SQL in combination with Exact Online. This concerns large numbers of Windows servers, PCs, Apple Macs and Linux servers in mainly Western Europe with a wide distribution in terms of available bandwidth and network latency.
95-Percentile
The first three measurements concern the so-called 95-percentile. This is slightly different from the average response time. Because response times cannot be negative, are limited at the top by a timeout and occasionally large outliers upwards are possible, an average and/or standard deviation of the response time is a less meaningful value.
Agreements often choose to work with a limit value within which a measurement must fall in a percentage of cases, for example that a web page is built within 2.5 seconds in 95% of cases. The 95 percentile is arbitrarily chosen based on experience with Service Level Agreements. For example, the Google Core Web Vitals use the 75 percentile to represent the performance.
Response Time
The 95 percentile of response times does not say everything in an absolute sense. If 94% of all Exact Online API calls have a download time of 1 ms and the rest of 10 minutes, the 95 percentile shows 10 minutes. But the 95 percentile is also 10 minutes when 94% takes 9 minutes and the rest takes exactly 10 minutes. Other key figures can enhance the measurements in terms of expressiveness, but at the moment this is not possible with the visualization tool used.
In general, a response time to an Exact Online API of more than 10 seconds will be unacceptably long, especially for data that an interactive user is waiting for. And again, variations along the time axis indicate trends.
For example, in the graph below, it can be seen in the top image that fetching a page with 1,000 rows via the Exact Online sync APIs fluctuates greatly in terms of response times, with roughly 1 second being the lower limit. For partial pages, the situation changes more dramatically over the course of the day, as can be seen by the relatively high peak around 10 am:
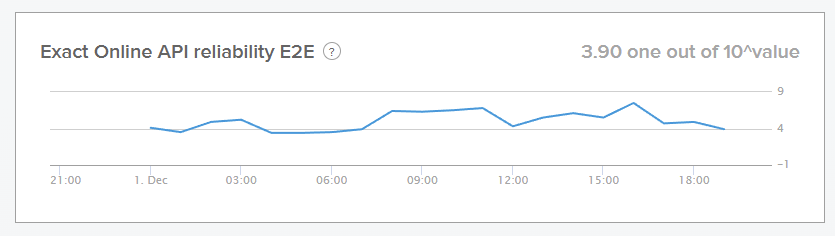
Exact Online Reliability
The reliability of receiving a response to an Exact Online API request is also measured over time.
Reliability varies widely, from 10% failed requests to one in a million. Therefore, reliability is expressed on a logarithmic scale: a step up on reliability means a 10x lower chance of a failed API request.
Failure of an Exact Online API request can be anything and are all heavily weighted in terms of status, such as:
- a timeout on the network,
- an error message from the software behind the Exact Online API,
- an error message from SQL Server software under Exact Online due to the connection pool filling up,
- an error message by the DNS server in the corporate network.
In the status image below, ‘3.9’ means that in the last measurement period, 1 in 8,000 (10^3.9) API requests failed (for any reason):
Note that the reliability is the end-to-end reliability: from the requesting device via the Internet to the Exact Online company data and completely back. So the reliability also depends on local conditions. When the national KPN-Internet is down for 2 minutes, most users of Invantive SQL software will not notice this because of the automatic error correction, but the number of failed API requests will go through the roof.
Updates
For incidents on components, it is possible to stay informed of outages for free via email and SMS. Please use the “Subscribe” button to do so.
Currently it is not possible to be automatically notified when Invantive Cloud or Exact Online is working slowly. In case this persists an Invantive employee will have to assess this manually and turn it into an incident.