As users within a company use more and more Power BI reports and/or datasets, it becomes more complex to figure out why reports sometimes take longer. Many tips are already described in the overview article Overview of Power BI Performance and Download Size Improvement Techniques.
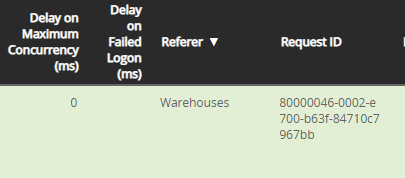
For traceability we recommend setting the Referer header as described in Link downloads to Power BI data sets. This Referer-header is now also visible in the Bridge Online Monitoring overview:
In addition, the total processing time (“Total Duration (ms)”) is now also shown broken down by the different components. Each of these components can be seen as a queue in which requests are waiting to be processed.
- “Processing Duration (ms)”: the actual duration of processing the request.
- “Delay on Identical Requests (ms)”: if more than one exactly the same question is asked via an OData request, then one is handled and the rest get the same answer as the previous ones as soon as finished.
- “Delay on Maximum Concurrency (ms)”: if more requests are submitted than the number of available queues of the subscription, some of the requests will be stalled until there is free capacity.
- “Delay on Failed Logon (ms)” : an extra pause (increasingly getting longer on continued failure) will be applied if an error message occurs due to an authentication failure.
Relationship of components
The various components roughly add up to the total processing time. It is acceptable for the totals to be a few milliseconds apart.
The different components of the processing are related. For example, the “Processing Duration” may have room for improvement for example by using a slow table or lack of a filter. An unnecessarily slow request will occupy capacity for a long time. Because of this, other requests will have to wait relatively more often until capacity is free and because of this, a higher value is shown in “Delay on Maximum Concurrency”.
High values for “Delay on Failed Logon”.
If especially the “Delay on Failed Logon” column has high values, it is recommended to check that all the servers being used do have the correct login credentials and passwords. Use the column “Referer” to make the chains easily analyzable as described in Link downloads to Power BI data sets.
Failed login requests are usually not currently visible in Bridge Online Monitoring because they are filtered out by data security. Under some conditions they are visible, for example in case of an expired invoice. Invantive Support can see all requests and will see for example:
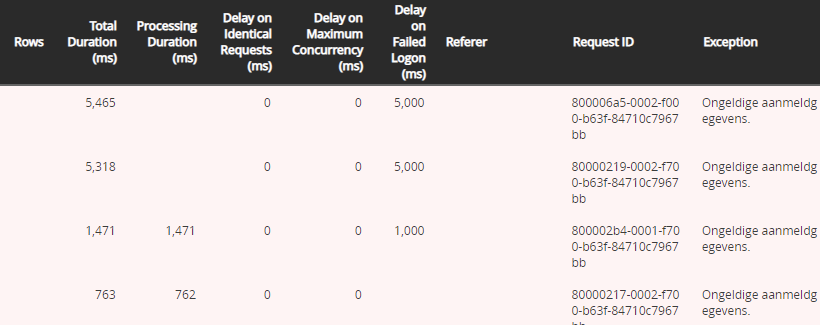
The image with failed login attempts also shows that an increasingly longer delay is used to prevent abuse.
High values for “Delay on Maximum Concurrency”
If there are high values especially in the “Delay on Maximum Concurrency” column, the recommendation is:
- Make sure that individual requests are handled faster so that they free up a slot for another request. In doing so, follow the tips at Overview of Power BI Performance and Download Size Improvement Techniques.
- Consider a larger subscription. The Free Plan has up to 1 active request, the Invantive Office for Entrepreneurs and Invantive Office for Accountants has 4. Larger subscriptions offer 8, 16 or more simultaneous active requests.
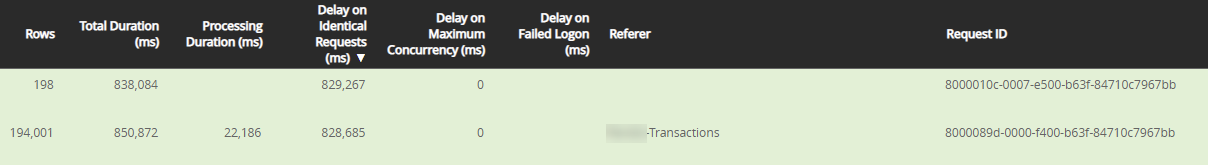
High values for “Delay on Identical Requests”
If there are high values especially in the “Delay on Identical Requests” column, the recommendation is:
- Adjust the dataset/report to ask for data less often with the exact same request. Use the “Referer” column to make chains easily analyzable as described in Link downloads to Power BI data sets.
The example below shows how a request that takes 22 seconds first had to wait about 13 minutes for the identical requests to finish:
High values for “Processing Duration”
If especially in the column “Processing Duration” there are high values, then the recommendation is to optimize the queries. Many tips for this can be found at Overview of Power BI Performance and Download Size Improvement Techniques. Especially for accountants it can be wise not to read out hundreds of administrations.
An example of larger processing times are:
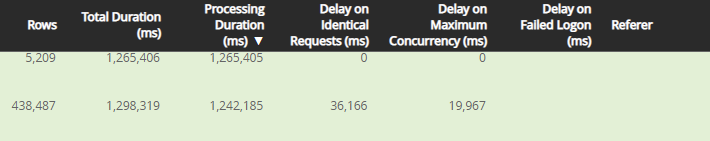
The bottom line shows that processing took over 20 minutes, but was preceded by a delay on an identical request (which apparently failed, e.g., due to a missing timeout) and a limitation on the number of available queue tracks.
An example of a download that was aborted because probably the Power BI dataset had too low a timeout is:

The timeout can be set as depicted in Avoid timeout error on Power BI OData download.