Johns Hopkins publishes a set of COVID-19 data on https://coronavirus.jhu.edu/map.html for which detailed data is available on GitHub. This articles explains how to structure these data sets in a format suitable for running Invantive SQL queries and uses the data to perform compare countries by outbreak speed based upon cohort numbers. Some outcomes are presented with no intent of scientific correctness and full coverage.
For handling CSV files correctly, please use Invantive SQL 17.33.325 BETA or a 17.34 PROD release.
Measurements
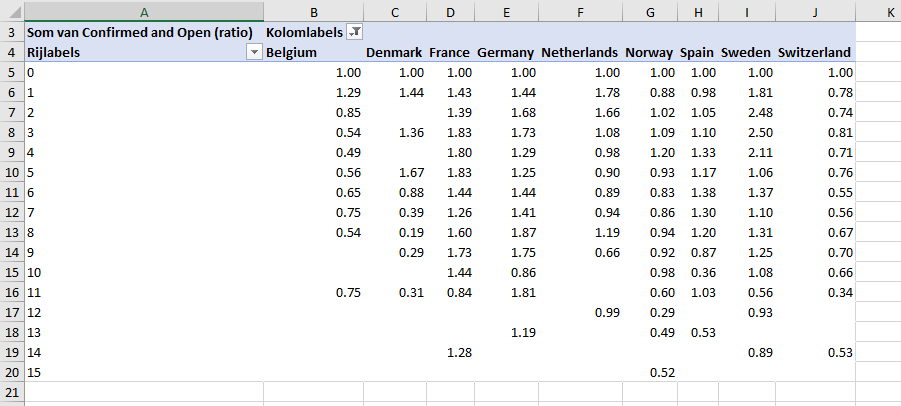
Results for countries with at least a 2018 population of 5.000.000 people and measurements for 8 cohort values. Cohort 0 starts at the time series first exceeding 1 per 1.000.000 people; this matches the definition used by DataGraver on Twitter. Cohort values are defined as days between registration moment (not publication moment) and cohort 0.
Countries along x-axis and cohort values defined as registration date along y-axis:
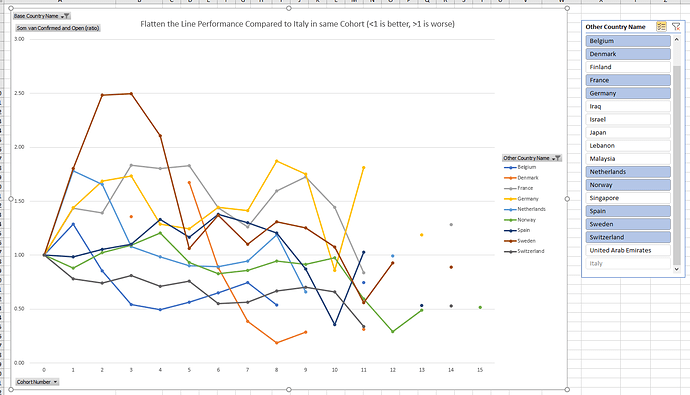
Graphically:
Discussion
The time period studied includes only two weeks of data from Johns Hopkins. All countries start at a ratio of 1 by definition.
The selected countries all display a ratio of open confirmed cases compared with Italy between 0.5 and 2 for almost all measurements, despite countries having different testing criteria and various countries implementing changes in testing criteria and policy during the time period studied.
Countries that on early cohort transitions move below 1, typically keep a ratio below 1 (Belgium, Switzerland, Norway).
Countries that on the first cohort transition move above 1 (rapid increase) keep a ratio above 1 for a number of cohorts, but seem to move downwards on a structural basis 7 days later (no correlation was calculated to prove this).
The consistent steep decline of Denmark (orange) from cohort 5 to 9 is striking (orange).
Germany and Spain seem less in control at the last measurements than countries such as Norway, Sweden and Finland. The Nordics typically have entered cohort 0 later on calendar date.
In general, Nordics seem to perform better than central european countries lowering the ratio. Perhaps they have learnt from previous experiences by other countries.
Attachments are avilable for download:
| File | Edited |
|---|---|
| Microsoft Excel-spreadsheet base.xlsx | 15-03-2020 by forums |
| PNG-file graph.png | 15-03-2020 by forums |
| PNG-file table.png | 15-03-2020 by forums |
Gather Data
The time-series are pivoted with the date running along the X-axis, making it less suitable for mass analysis since it required unpivoting. The daily data sets are instead used as source.
Execute the following steps:
- Clone the COVID-19 git repository to a folder such as ‘c:\ws\COVID-19’.
- Connect to Invantive SQL using for instance Invantive Query Tool with the bundled in-memory Dummy sample database.
- Execute the “Gather data script” listed below, for instance using F5 (Execute All).
- Data exists as an in-memory table c19daily.
- Then transform the data using the transform script.
- An output Excel workbook is created to which you can add a pivot table or chart.
- The result is attached as base.xlsx.
Gather Data Script
The following script collects the data using Invantive SQL with some Invantive Script statements:
local define DAILY_DB_FOLDER "C:\ws\COVID-19\csse_covid_19_data\csse_covid_19_daily_reports"

local define WORLD_FOLDER "C:\ws\COVID-19\csse_covid_19_data"

create or replace table c19daily@inmemorystorage
as
select to_date(regexp_replace(fle.file_path, '.*\\([0-9][0-9])-([0-9][0-9])-([0-9][0-9][0-9][0-9]).csv', '$3$1$2'), 'YYYYMMDD') date_published
,      c.state
       label 'Province or State'
,      c.country
       label 'Country or Region'
--
-- Remove time to enable calculation of cohorts per day.
--
,      trunc(to_date(c.date_last_update_c))
       day_last_update
       label 'Last Updated Day'
,      to_date(c.date_last_update_c)
       date_last_update
       label 'Last Updated'
,      c.confirmed_cnt
       label '#Confirmed'
,      c.deaths_cnt
       label '#Deaths'
,      c.recovered_cnt
       label '#Recovered'
,      c.confirmed_cnt
       - coalesce(c.deaths_cnt, 0)
       - coalesce(c.recovered_cnt, 0)
       confirmed_open_cnt
       label '#Confirmed and non-final'
,      fle.file_path
       orig_system_group
       label 'Original System Group'
from   files('${DAILY_DB_FOLDER}', '*.csv', false)@os fle
join   read_file_text(fle.file_path)@os rfe
join   csvtable
       ( passing rfe.file_contents
         column delimiter ','
         skip lines 1
         columns state              varchar2 position 1
         ,       country            varchar2 position 2
         ,       date_last_update_c varchar2 position 3
         ,       confirmed_cnt      number   position 4
         ,       deaths_cnt         number   position 5
         ,       recovered_cnt      number   position 6
       ) c
--
-- Canada reports figures per province, but only when
-- there are changes.
--
where  c.country not in ('Canada')

--
-- Establish country population data.
--
-- Download and unzip the XML from http://api.worldbank.org/v2/en/indicator/SP.POP.TOTL?downloadformat=xml
-- and place it in the folder with daily reports.
--
-- Then create a table with population data.
--
create or replace table world@inmemorystorage
as
select xml.*
from   read_file_text('${WORLD_FOLDER}\API_SP.POP.TOTL_DS2_en_xml_v2_821172.xml')@os rft
join   xmltable
       ( '/Root/data/record'
         passing rft.file_contents
         columns country_key  varchar2 path 'field[1]/@key'
         ,       country_name varchar2 path 'field[1]'
         ,       item_key     varchar2 path 'field[2]/@key'
         ,       item_name    varchar2 path 'field[2]'
         ,       year         number   path 'field[3]'
         ,       value        number   path 'field[4]'
       ) xml
Transform Data Script
The following script transforms the data into cohort statistics:
--
-- Last time an update for a specific day
-- was published. For instance, the data sets of
-- March 11, 12 and 13 contain data on the Netherlands
-- of March 11, although time of day varies.
--
create or replace table c19daily_last@inmemorystorage
as
select country
,      day_last_update
,      max(date_published)
       date_published_last
from   C19DAILY@InMemoryStorage c
group
by     country
,      day_last_update

--
-- Daily statistics limited to some countries, aggregated per country.
--
create or replace table c19daily_sub@inmemorystorage
as
select country_key
,      population_cnt
,      country_name
,      day_last_update
,      date_published
,      confirmed_cnt
,      confirmed_open_cnt
,      deaths_cnt
,      recovered_cnt
,      confirmed_cnt / population_cnt * 1e6
       confirmed_pm
       label 'Confirmed (per million)'
,      confirmed_open_cnt / population_cnt * 1e6
       confirmed_open_pm
       label 'Confirmed and open (per million)'
,      deaths_cnt / population_cnt * 1e6
       deaths_pm
       label 'Deaths (per million)'
,      recovered_cnt / population_cnt * 1e6
       recovered_pm
       label 'Recovered (per million)'
from   ( select w.country_key
         ,      w.value population_cnt
         ,      w.country_name
         ,      c.day_last_update
         ,      c.date_published
         ,      sum(c.confirmed_cnt)
                confirmed_cnt
         ,      sum(c.confirmed_open_cnt)
                confirmed_open_cnt
         ,      sum(c.deaths_cnt)
                deaths_cnt
         ,      sum(c.recovered_cnt)
                recovered_cnt
         from   world@inmemorystorage w
         join   C19DAILY@InMemoryStorage c
         on     c.country = w.country_name
         --
         -- Use last measurement for a day.
         --
         and    c.country || '-' || to_char(day_last_update, 'YYYYMMDD') || '-' || to_char(date_published, 'YYYYMMDD')
                in
                ( select country || '-' || to_char(day_last_update, 'YYYYMMDD') || '-' || to_char(date_published_last, 'YYYYMMDD')
                  from c19daily_last@inmemorystorage
                )
         where  w.year         = 2018
         --
         -- Optional filter.
         --
         -- and    w.country_key in ('BEL', 'AUT', 'CAN', 'DNK', 'FRA', 'DEU', 'ITA', 'NLD', 'CHE', 'ESP')
         group
         by     w.country_key
         ,      w.value
         ,      w.country_name
         ,      c.day_last_update
         ,      c.date_published
       )

--
-- Cut-off dates moving country-specifics statistics along time-axis
-- to all start on day first exceeding 1 pm.
--
create or replace table c19country_start_dates@inmemorystorage
as
select country_key
,      min(day_last_update)
       day_threshold_first_met
from   c19daily_sub@inmemorystorage
where  confirmed_cnt / population_cnt >= 1 / 1e6
group
by     country_key

--
-- Data after cut-off date.
--
create or replace table c19daily_subc@inmemorystorage
as
select cde.*
,      cde.day_last_update - cse.day_threshold_first_met
       cohort
from   c19daily_sub@inmemorystorage cde
join   c19country_start_dates@inmemorystorage cse
on     cse.country_key      =  cde.country_key
and    cde.day_last_update >= cse.day_threshold_first_met

--
-- Select countries with a large population (5e6)
-- and at least measurements for 8 cohort values.
--
create or replace table c19selected@inmemorystorage
as
select country_key
from   ( select country_key
         ,      count(cohort) cohort_cnt
         from   c19daily_subc@inmemorystorage
         where  population_cnt >= 5e6
         group
         by     country_key
       )
--
-- At least measurements on 8 cohort values.
--
where  cohort_cnt >= 8

create or replace table c19cohortstats@inmemorystorage
as
select cdebase.country_key
       base_country_key
       label 'Base Country Code'
,      cdebase.country_name
       base_country_name
       label 'Base Country Name'
,      cdebase.cohort
       label 'Cohort Number'
,      cdebase.confirmed_pm
       base_confirmed_pm
       label 'Base Confirmed (pm)'
,      cdebase.confirmed_open_pm
       base_confirmed_open_pm
       label 'Base Confirmed and Open (pm)'
,      cdebase.deaths_pm
       base_deaths_pm
       label 'Base Deaths (pm)'
,      cdebase.recovered_pm
       base_recovered_pm
       label 'Base Recovered (pm)'
,      cde2.country_key
       label 'Other Country Code'
,      cde2.country_name
       label 'Other Country Name'
,      cde2.confirmed_pm
,      cde2.confirmed_open_pm
,      cde2.deaths_pm
,      cde2.recovered_pm
,      case
       when cde2.confirmed_pm != 0
       then cdebase.confirmed_pm / cde2.confirmed_pm
       end
       confirmed_ratio
       label 'Confirmed (ratio)'
,      case
       when cde2.confirmed_open_pm != 0
       then cdebase.confirmed_open_pm / cde2.confirmed_open_pm
       end
       confirmed_open_ratio
       label 'Confirmed and Open (ratio)'
,      case
       when cde2.deaths_pm != 0
       then cdebase.deaths_pm / cde2.deaths_pm
       end
       deaths_ratio
       label 'Deaths (ratio)'
,      case
       when cde2.recovered_pm != 0
       then cdebase.recovered_pm / cde2.recovered_pm
       end
       recovered_ratio
       label 'Recovered (ratio)'
from   c19daily_subc@inmemorystorage cdebase
join   c19daily_subc@inmemorystorage cde2
--
-- Same cohort.
--
on     cde2.cohort      =  cdebase.cohort
and    cde2.country_key != cdebase.country_key
and    cde2.country_key in (select country_key from c19selected@inmemorystorage)
where  cdebase.country_key in (select country_key from c19selected@inmemorystorage)

select base_country_name
,      country_name
,      cohort
,      case
       when cohort = 0
       then 1
       else confirmed_open_ratio
       end
       confirmed_open_ratio
       label 'Confirmed and Open (ratio)'
from   c19cohortstats@inmemorystorage
order
by     base_country_name
,      country_name
,      cohort

local export results as "c:\temp\base.xlsx" format xlsx include headers

