The new release of Invantive Cloud now also displays multiple statistics in Live Monitoring about the use of the APIs of the linked platforms.
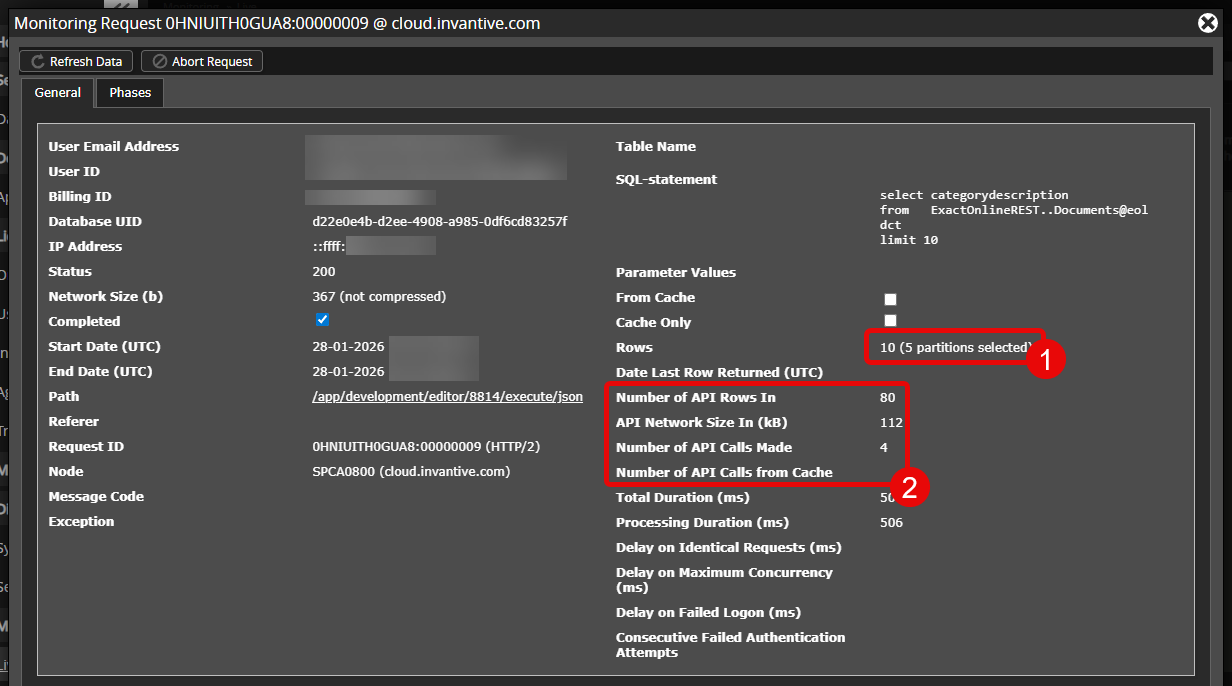
The UniversalSQL query shown explicitly instructs the system to retrieve a maximum of 10 rows. As indicated by the red (1), five partitions (in this case Exact Online companies) have been selected.
Invantive UniversalSQL will then retrieve the requested data from multiple partitions simultaneously. This is usually limited to eight partitions at a time.
The red (2) shows that since this release:
- A total of 4 API calls were made before the query ended. The fifth partition was no longer needed because at least 10 rows had already made available.
- A total of 80 rows were loaded into the processing pipeline before the query ended. The first 10 were used and the rest were discarded.
- The rest of the 240 rows that had already been retrieved with four API calls in this case also were discarded because they were no longer needed.
- There was a total of 112 KB of network traffic (after decompression) with the underlying API platform, in this case Exact Online. The final query response contained 367 bytes.
- No data from a memory or disk cache was used.
The new key figures are gathered for all (cloud) platforms, are fully integrated into the operation of UniversalSQL and cause negligible overhead.
The underlying details can also be consulted in the ‘Session I/Os’ screen, with the remark that data in the screen may be delayed by up to 10 minutes compared to Live Monitoring.
The information is available to users for up to 24 hours after a query was executed.
The statistics are regularly updated with data from a partition as soon as rows from the partition become available. This happens in bursts for *Incremental tables.
Details
The figures can sometimes be confusing. For example, when using the *Incremental tables on Exact Online, complex calculations are performed to check completeness and integrity, and to update the data with recent information.
In an environment with approximately 7,500 items spread across five administrations, repeated execution of the following query will produce a complex picture:
select count(*)
from   ItemsIncremental@eol
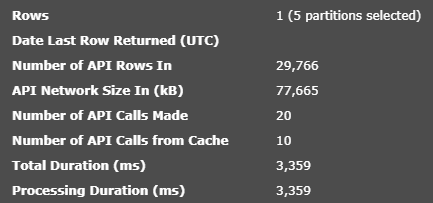
According to the above picture, nearly 30,000 rows were processed in the pipeline, with 77 MB of API passing through the pipeline. A total of 10 API calls were answered from a cache and 20 API calls were executed on the actual platform.
The display may be further improved in future releases.