For Invantive Power BI users, the new zoom-in option for API call requests provides direct insight into performance and API usage: for each request, you can see how much data and how many rows were retrieved, from how many administrations, how many API calls were required, and how long each step took. By zooming in to the Session IO level, you can see where delays occur and whether data comes from the cache. This makes optimisation, cost control and maintaining stable reports a lot easier.
Zooming in
Invantive Cloud has recently introduced a timeline, where requests for a period such as a day are listed horizontally with the time. This makes it quick and easy to determine the number of requests and their duration:
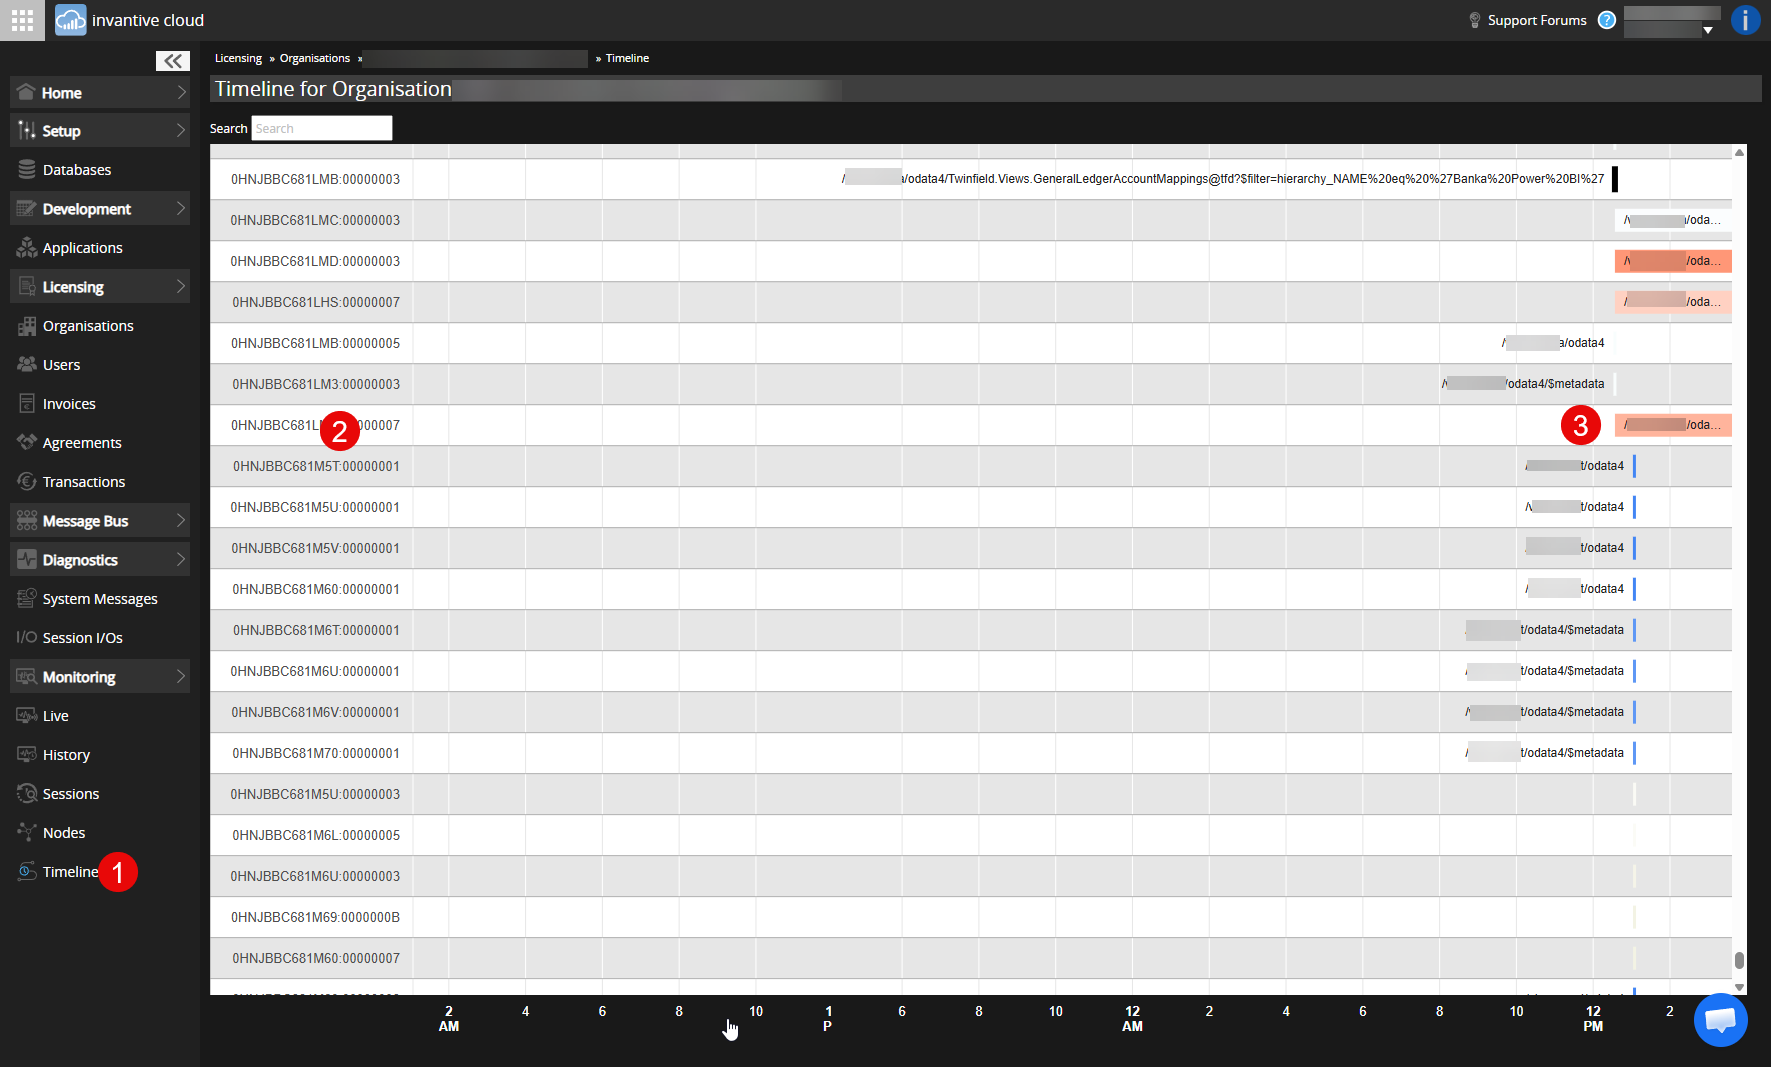
The Timeline can be found in the Monitoring menu (red 1). When you hover over a request (red 2 and red 3), a window will pop up.
By clicking on the request, the details of the request will be displayed:
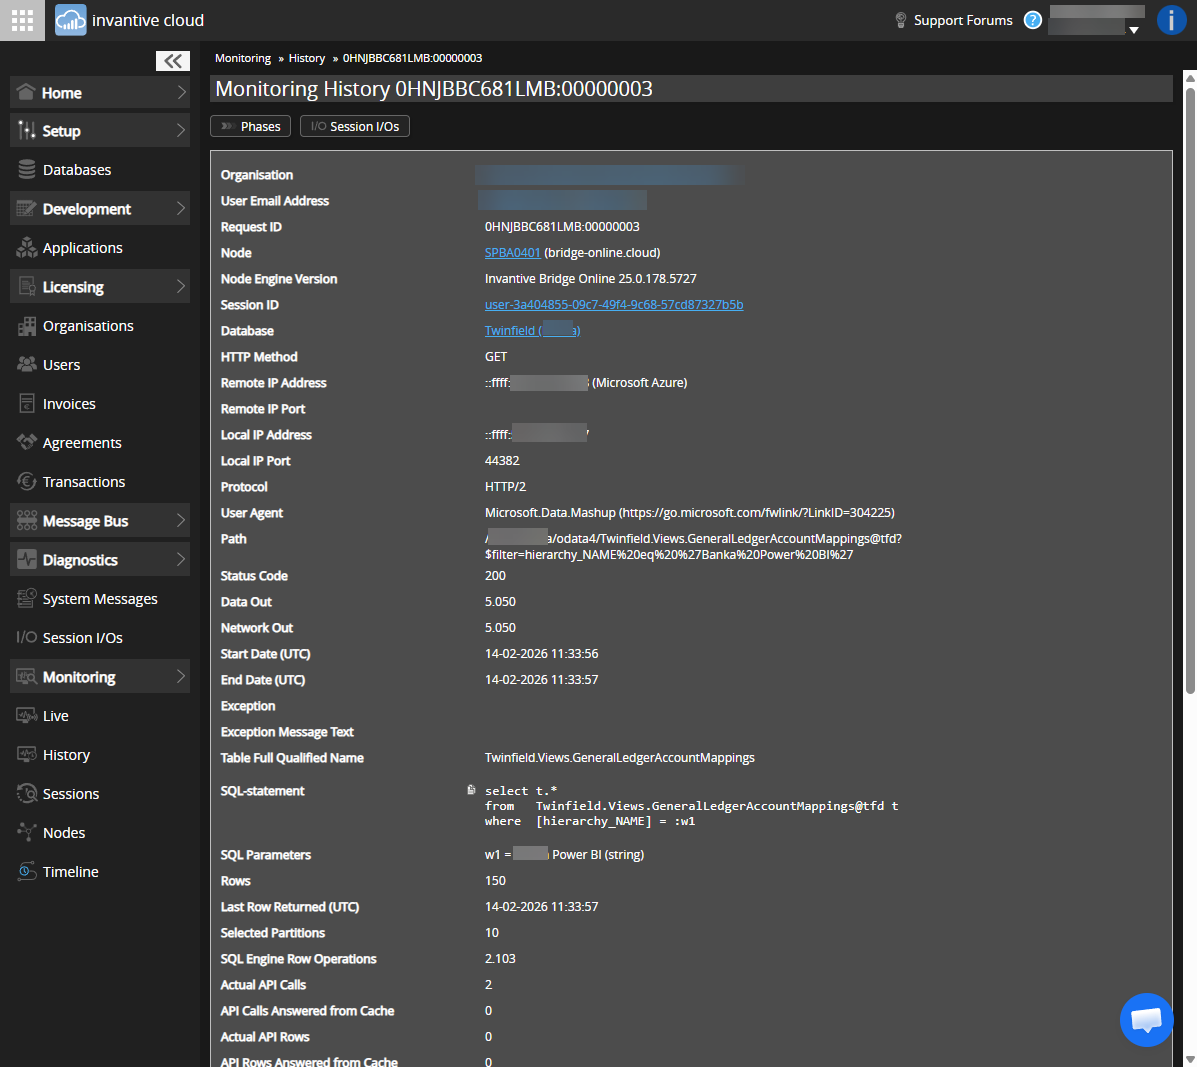
This request shows that approximately 5 KB of data was retrieved, consisting of 150 rows from a maximum of 10 Twinfield administrations. The number of API calls was limited to 2.
You can now use the Session-IOs button to request the corresponding API calls:
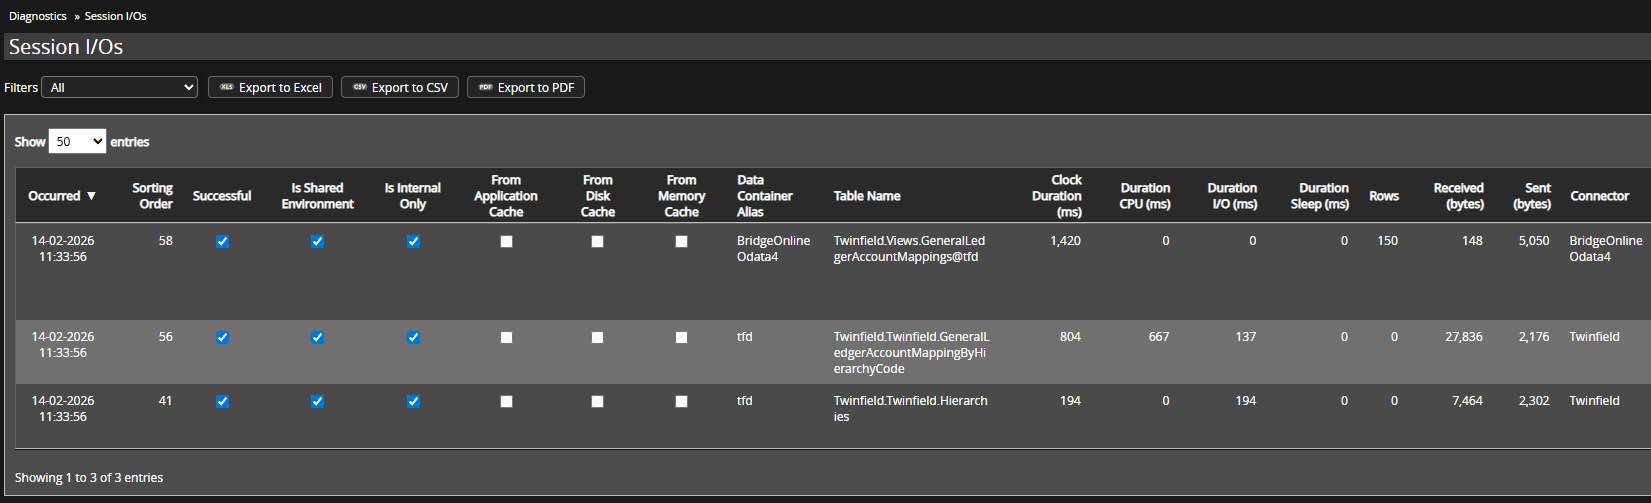
Note that there are three session I/Os on the screen: one of the session I/Os was not an API call but the return of 5 KB of data to Power BI in this case.
The columns accurately describe how long the API calls took, how much data was exchanged, and whether the data is fresh or comes from a cache. Often, the number of rows is also visible.
Attention! Please note that only data from requests made on the current day (since 0:00 UTC) is visible. Session I/Os from previous days are not available.