Freshdesk tickets_incremental keeps spinning

We are facing issues connecting to tickets_incremental, even if I just want to preview the data from Power BI dataflow, without any transformations, it’s just spinning and spinning (loading) for minutes without any results.

I haven’t noticed this problem with any other FreshDesk table.

This is my query:

let
  Source = OData.Feed("https://bridge-online.cloud/acme-freshdesk/odata4",
null, [Implementation="2.0", ODataVersion=4,
 OmitValues=ODataOmitValues.Nulls, Timeout=#duration(0,4,0,0)]),

  #"Navigation 1" = Source{[Name = "Freshdesk.Freshdesk.tickets_incremental@fdk", Signature =
"table"]}[Data],

  #"Filtered rows" = Table.SelectRows(#"Navigation 1",
each [created_at] >= #datetimezone(2022,
1,
1,
0,
0,
0,
1,
0)),
...

As visible here it takes very long:

Duration of loading tickets_incremental can vary widely, depending on whether a full (re)load is done or only an increment. On a full (re)load - even when just 1 row is retrieved - the whole dataset will be retrieved.

Typical 95% probability response time for full (re)load is like 1 second per 100 rows in the full dataset. For instance, when there are 100.000 tickets, the initial response time can be as much as 1.000 seconds, even for 1 row.

Once the whole dataset is cached, the duration of an update is significantly shorter, and can be as little as 15 seconds for the same datavolume depending on the available CPU capacity and network latency.

The actual API calls on Freshdesk can be found in the form “Session I/Os” (archived every day at 00:00 UTC).

Can you include an (anonymized) screenshot of the associated request from Invantive Bridge Online Monitoring (see More insight with new Bridge Online Monitoring) with the title including request ID visible?

Not sure what can be the cause but this worked before. It started failing since 12/03/2024.

Error:
Refreshing an entity exceeded the 2 hour refresh limit.
Request ID: b771a99b-cfb7-71c1-cca2-ad414fc392bc
Activity ID: 996fcc26-5873-4b0e-9827-22a0d5e646b7

Here is the screenshot from Bridge Online Monitoring:

Hi Support,

Unfortunately I’m still not able to refresh our Ticket data. All refresh attempts are failing. I noticed something interesting, in Power BI dataflow when I want to preview the table, it will not load, fails with Evaluation was canceled. However in Bridge Online Monitoring the DataRetrieval completes with “Completed retrieval of 100 rows from query on ‘Invantive.Freshdesk.Freshdesk.tickets_incremental@fdk’”. For your reference: Monitoring Request 0HN27GF811TDT:00000002

I only have issues with the tickets_incremental, the rest of the tables are loading.
The same process works from Power BI desktop, preview loads…
I tried creating a new query from scratch in Dataflow, it failed again with “Evaluation was cancelled”
Please help.

We need to refresh our data, so I tried to leave out Dataflow for now. However when I tried to preview the tickets_incremental on my local machine in Power BI desktop, it was loading data for over 40 minutes, then it failed with the following error:

Log failed retrieval.
So far retrieved 0 rows on ‘Freshdesk.Freshdesk.tickets_incremental’ in 2,597,082 ms.
itgenoda489: You have exceeded the limit of requests per hour.
itgenclr083: The remote server returned an error: (429) Too Many Requests.

It’s just a preview, first 1000 rows. Please advise how to fix it.

We are already using the suggested timeout settings:

Source = OData.Feed("https://bridge-online.cloud/XXXXXX-freshdesk/odata4", null, [Implementation="2.0", ODataVersion=4, OmitValues=ODataOmitValues.Nulls, Headers=[Referer = "FreshDesk-Tickets-Incremental" ], Timeout=#duration(0,4,0,0)]),

Monitoring Request is 0HN27GF812AFI:00000002.

Refresh started in DataFlow at 12:05:24 CET, at 13:25 it seems it’s still running:

When I check the Monitor, it says it already failed:
The data download was cancelled after 14 minutes, 53 seconds, such as by the user navigating away in the Power BI or Power Query user interface. Please optimize your query as described on Overview of Power BI Performance and Download Size Improvement Techniques - invantive. Then re-run the query

Monitoring Request 0HN27GF812CDE:00000002

Using delegation, the following SQL was executed on the UniversalSQL editor on Invantive Cloud using an empty cache:

set use-http-disk-cache false

set use-http-memory-cache false

select count(*) 
from   tickets_incremental

Last query returned 64460 rows. Execution time was 615 seconds.

Execution took 1652 API calls. Of these were 2 API calls to get the spam tickets, and 2 API calls to get the deleted tickets. The other 1648 API calls were calls to retrieve tickets updated since a specific date, including statistics. Since each of these 1652 also includes the statistics, the total number of API credits used will be 3304.

An optimization will be included in 24.0.100 to remove the unneeded collections of statistics from spam and deleted tickets. This saves 4 API credits in this scenario.

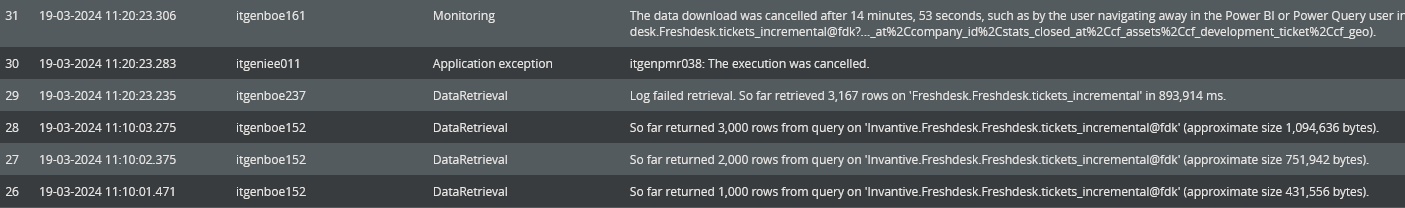
Using 1648 API calls with each at most 100 rows to retrieve 64460 rows is not efficient. This indicates that only 40% of the maximum payload is effectively used. A percentage of 100 is not always realistic achievable given the limitations of the Freshdesk API protocol, but it should be closer. An analysis will be made to study possibilities to reduce the number of API calls needed.

The last query was then re-run using a filled incremental cache. The execution time was 33 seconds. The query consumed 826 API calls, which is way too much. Each API call retrieved data one second apart. This might be related to the previous found ineffiency. Together with the previous problem this will be studied further.

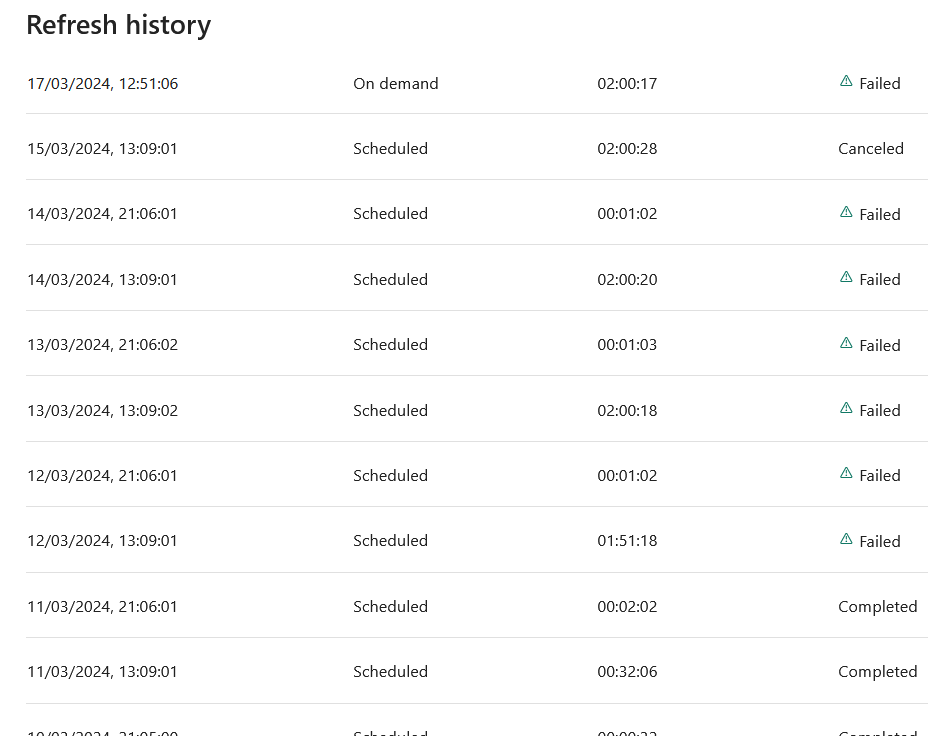
From the information it seems that the problem started occurring when a change on surveys for Freshdesk was taken into production.

From the looks of it, a bug was introduced and depending on the data volume, Freshdesk Plan and hourly/minutely rate limits being applied it will surface.

Once the analysis is done, a reply will be added.

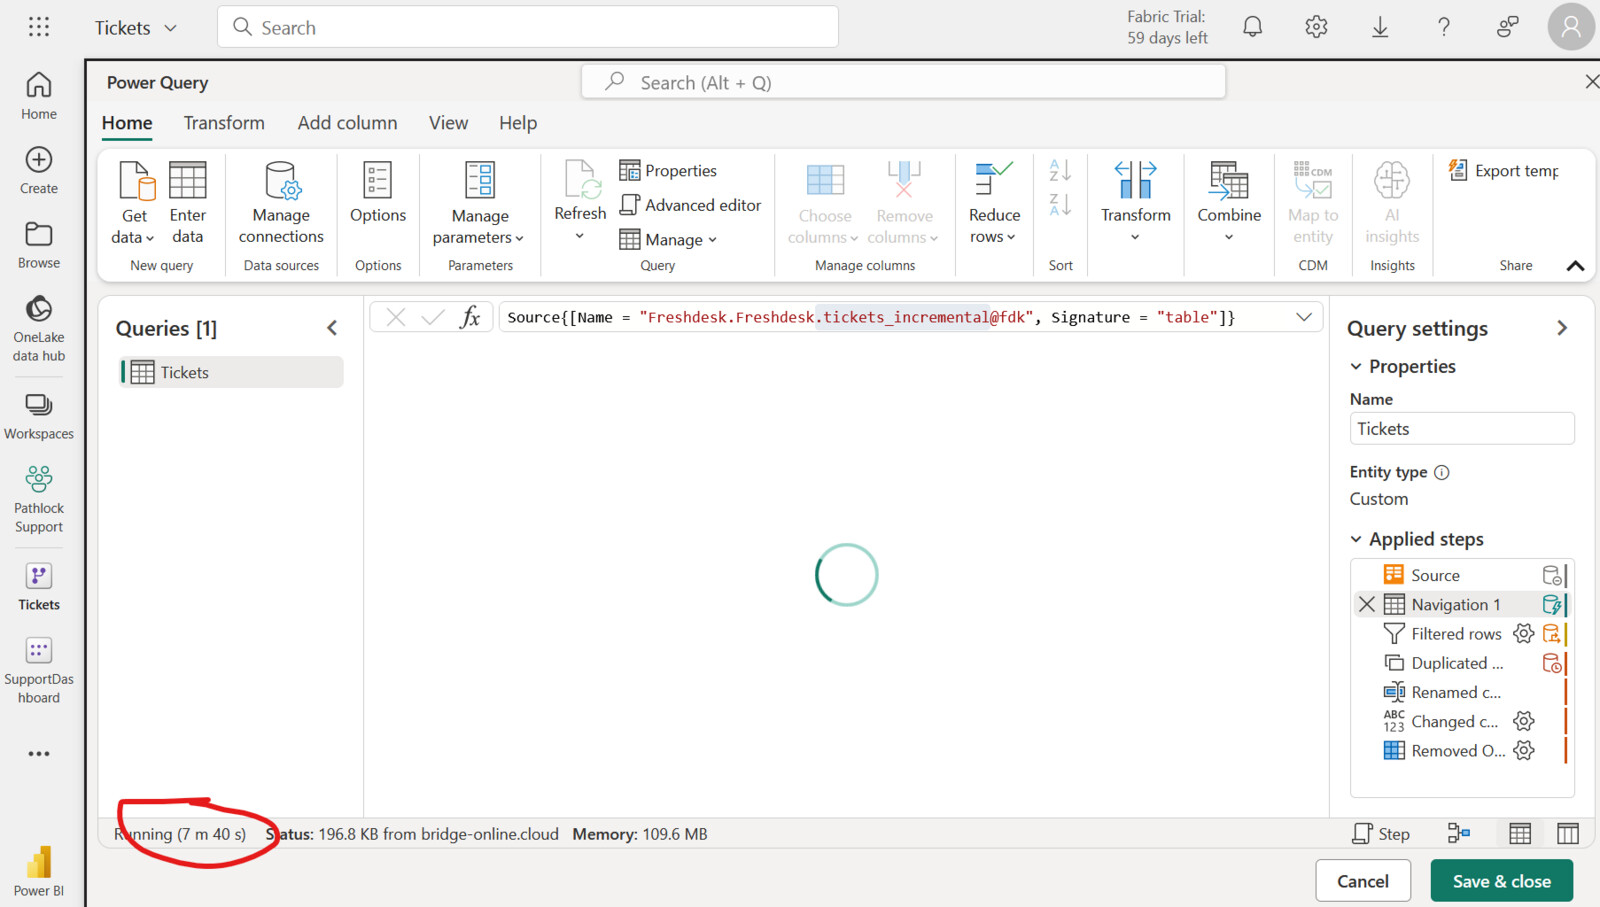
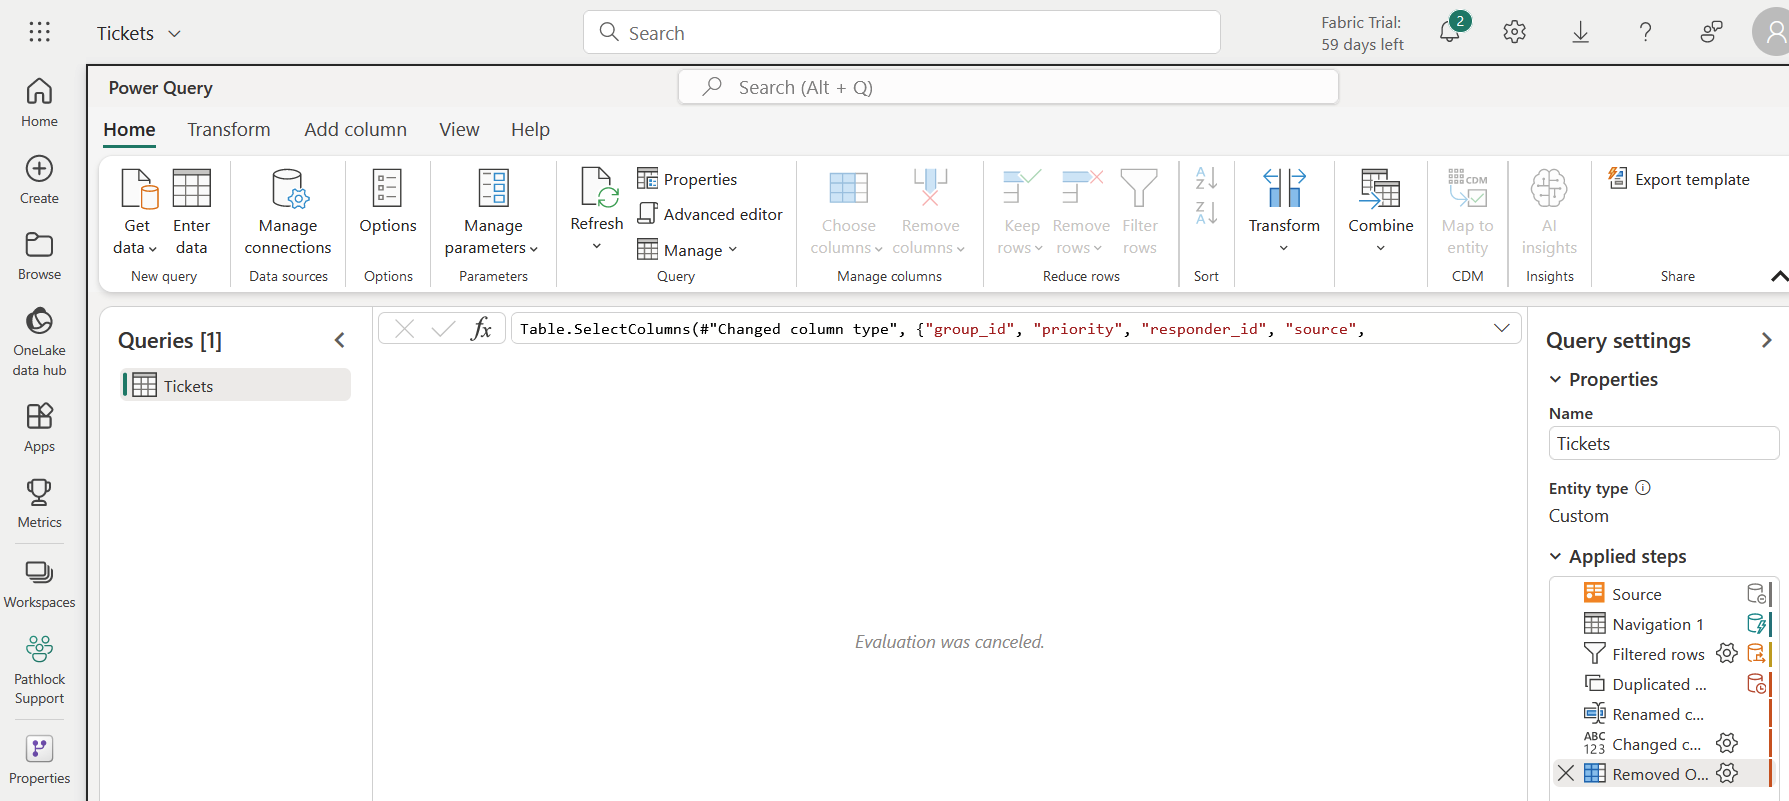
Background 429 errors and Extremely Slow Response / Spinning

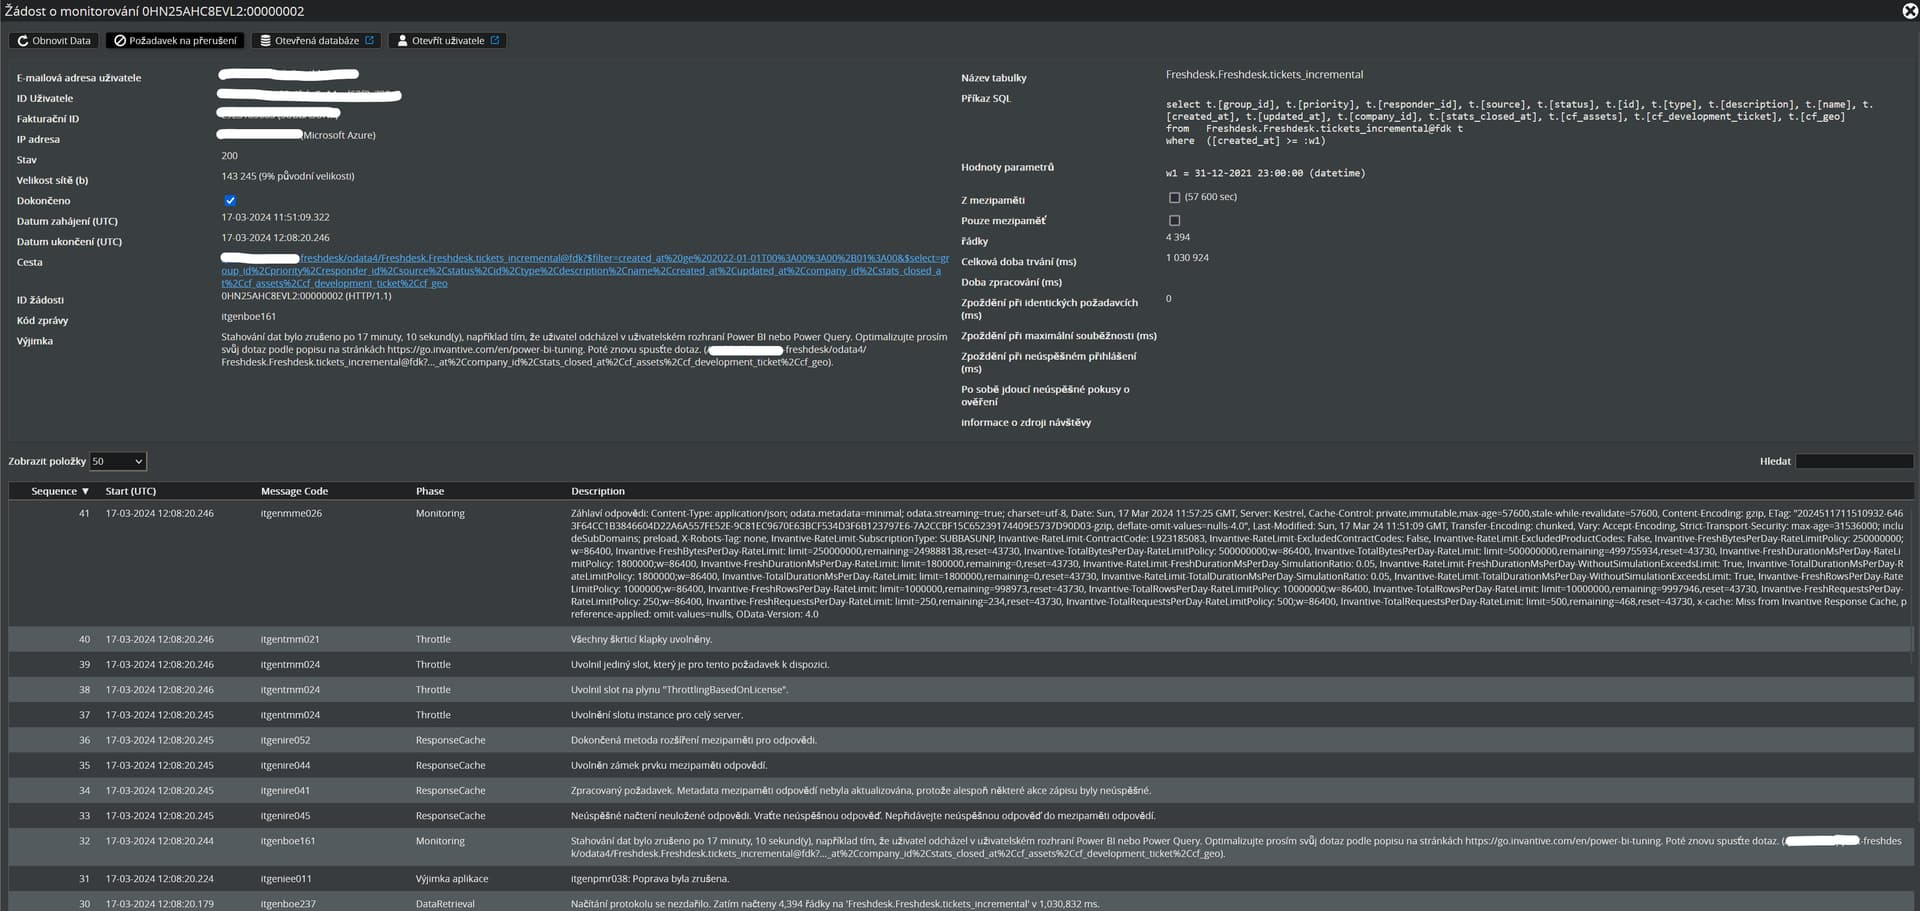
The slow response and 429 error indicate that the API rate limit for API calls on Freshdesk was exceeded (see https://developer.freshdesk.com/api/#ratelimit). The rate limits on Freshdesk vary widely. Depending on the plan there is a limit on the number of calls per minute.

It is weird that the error contains the following text:

You have exceeded the limit of requests per hour.

This indicates that an hourly rate limit is applied instead of the limit per minute. In the past Freshdesk limited the number of calls per hour instead of per hour. To switch to the new minute level rate limits, it is recommended to contact support@freshdesk.com. Typically these were between 3.000 and 5.000 (Blossom/ Garden 3000, Estate/Forest 5.000).

The Freshdesk driver also supports the hourly rate limits, but the technical features provided by those are more limited.

This might also explain the spinning. When the hourly limit is exceeded, a 429 error is thrown. In that case the Freshdesk driver will delay some (increasing and somewhat random) time and try again to execute the API call. With minutely limits and even with competing processes, this will typically succeed in at most a few tries.

However, with hourly rate limits, the retry mechanism will try again for 10 times by default, each time with a longer delay. This is configurable through connection string keys such as download-error-429-too-many-requests-max-tries (see SQL-Driverattributen voor Freshdesk API - Freshdesk API Data Model).

It is recommended to switch to the minute level rate limit. This provides new calls every minute instead of once per hour (which might cause a download to spin for one hour).

Please reach out to Freshdesk to have your plan switched after analyzing possible impact.

Thank you very much for your response. We will contact Freshdesk support and will discuss the possibility of switching our plan.

On the other hand yesterday I managed to refresh our data through Power BI Desktop, so I’m wondering why it succeeded through Desktop and failed through Dataflows.

Hopefully the plan adjustment will resolve this issue. Thanks again for you support!

The logic for determining the rate limit value is being adapted.

It will no longer assume that every user is on the new rate limits. The logic is a little sensitive, since the Freshdesk API server provides no hint what the duration of the window is.

In the next release, the previous rate limit per hour and the current rate limit per minute will be supported. The oldest rate limit of 1.000 API calls per hour in V1 API will NOT be supported.

1 like

To differentiate the issue, it seems that a very large percentage of the tickets was changed in the mroning of March 12 in the Freshdesk application itself, which negatively influences the algorithm optimized for reuse of caches.

The algorithm expects relatively frequent updates at the start of Freshdesk use (such a conversions), but then a rather stable flow of changes.

This event caused the algorithm to generate many more API calls than realistically necessary. The algorithm has been finetuned to compensate for such events.

It is expected that within the next few days this improvement will be taken into production on Invantive Cloud.

This can be found also in the analysis table using:

select url
,      updated_since_utc
,      page_rows_count
,      page_rows_added_count
,      page_rows_overwritten_count
,      first_ticket_id
,      last_ticket_id
,      to_char(start_overall_date_last_updated_utc, 'YYYYMMDDHH24MISS') start_overall_date_last_updated_utc
,      to_char(end_overall_date_last_updated_utc, 'YYYYMMDDHH24MISS') end_overall_date_last_updated_utc
,      to_char(min_date_last_updated_utc, 'YYYYMMDDHH24MISS') min_date_last_updated_utc
,      to_char(max_date_last_updated_utc, 'YYYYMMDDHH24MISS') max_date_last_updated_utc
from   statistics_incremental
where  download_group_name not like '%spam%'
and    download_group_name not like '%deleted%'
order 
by     created_at desc

Note the large number of entries with a value on March 12, 2024 for updated_since_utc. Over 60% of all tickets were updated.

A new release has been taken into production on Invantive Cloud. Due to changes in the cache algorithm, the number of API calls needed to initially load the data was reduced to 652 API calls on Freshdesk.

A refresh of tickets_incremental now consumes 12 API calls.

1 like

3 berichten zijn gesplitst naar een nieuw topic: Freshdesk question

Dit topic is 7 dagen na het laatste antwoord automatisch gesloten. Nieuwe antwoorden zijn niet meer toegestaan.